pprof & Load Testing
In the previous post, we built a simple Go webapp using the Gin webserver for authentication of users using Magic Links. However, how do we know that it actually works at scale? We need a way to benchmark the app with a proper load and see if it can support the number of users expected to use our app with an appropriate level of resource constraints to match business requirements. This is where pprof comes in handy, as it is already built into the Go package.
import (
	// ...

	//nolint:gosec // G108: pprof is only exposed on internal environments
	_ "net/http/pprof"

    // ...
)

func main() {
	// Start pprof HTTP server
	go func() {
		srv := &http.Server{
			Addr:         ":6060",
			ReadTimeout:  5 * time.Second,
			WriteTimeout: 5 * time.Second,
			IdleTimeout:  5 * time.Second,
		}

		if err := srv.ListenAndServe(); err != nil && err != http.ErrServerClosed {
			log.Fatalf("server failed: %v", err)
		}
	}()
    // ...
}
Importing the "net/http/pprof" package and spinning up a http server, will enable pprof analysis at the /debug/pprof/ route of your application.
As a side-note, gosec linting package will flag this as a security issue as it assumes you are exposing profiling data publicly. Remember that in the larger system architecture, your webserver will not be public facing and is usually hidden behind a proxy. A bastion host is usually setup for system administrators or engineers to interact with the pprof endpoints. Therefore, we can ignore this specific linting rule.
BASE_URL=http://localhost:6060
SAMPLING_PERIOD=30

# CPU Profile
curl -s "${BASE_URL}/debug/pprof/profile?seconds=${SAMPLING_PERIOD}"
# I/O Profile
curl -s "${BASE_URL}/debug/pprof/block?seconds=${SAMPLING_PERIOD}"
# Lock Contention Profile
curl -s "${BASE_URL}/debug/pprof/mutex?seconds=${SAMPLING_PERIOD}"
# # To answer: "How many objects are we creating per request?"
curl -s "${BASE_URL}/debug/pprof/heap?seconds=${SAMPLING_PERIOD}"

# Goroutine Profile
curl -s "${BASE_URL}/debug/pprof/goroutine?debug=2"
# Save inuse_objects (currently live objects)
curl -s "${BASE_URL}/debug/pprof/heap"
# Save inuse_space (bytes currently in use)
curl -s "${BASE_URL}/debug/pprof/heap"

# The ?gc=1 parameter triggers garbage collection before sampling

# Save alloc_objects (total allocations during profile)
curl -s "${BASE_URL}/debug/pprof/heap?gc=1"
# Save alloc_space (bytes allocated)
curl -s "${BASE_URL}/debug/pprof/heap?gc=1"
Once the server is up, we can gather metrics of our system by perform a GET request on the respective endpoints shown above.
We can then use the command line go tool to evaluate each profile accordingly; i.e. go tool pprof -http=:8081 ./cpu.pprof
The benchmarking script is defined in the repository as well.
Load Testing
Now that our server is ready to gather profiling metrics. We need to write a script to perform actual load testing on our server.
// ...

const (
	ConcurrentRequestsCount   = 500
	BenchmarkDurationSeconds  = 60
	Host                      = "http://127.0.0.1:8080"
	GenerateMagicRoute        = "/magic/generate"
)

func main() {

    // ...

	client := &http.Client{
		Timeout: 5 * time.Second,
	}

    // (1) Defining Context and Resource Management Constructs
	ctx, cancel := context.WithTimeout(context.Background(), BenchmarkDurationSeconds*time.Second)
	defer cancel()
	group, ctx := errgroup.WithContext(ctx)
	semaphore := make(chan struct{}, ConcurrentRequestsCount)

loop:
	for {
		select {
		case <-ctx.Done():
			break loop
		default:
            // (2) Trigger Requests in Goroutines
			semaphore <- struct{}{}
			group.Go(func() error {
				defer func() {
					<-semaphore
				}()
				req, err := http.NewRequestWithContext(ctx, http.MethodPost, Host+GenerateMagicRoute, nil)
				if err != nil {
					return err
				}
				req.Header.Set("X-CSRF-Token", generateCsrf())
				res, err := client.Do(req)
				if err != nil {
					return err
				}
                // Important! Need to read the body to release the http connection back to the pool.
				io.ReadAll(res.Body)
				defer res.Body.Close()
				return nil
			})
		}
	}
	if err := group.Wait(); err != nil {
		log.Println("request failed:", err)
	}

    // ...
}
In the /cmd/benchmark/main.go directory, a Go program is written to perform concurrent requests to the server's endpoints.
(1) Defining Context & Resource Management Constructs
A context is defined with a timeout parameter, to tell our program to exit once it reaches the time limit. This context is attached to an errgroup which is the construct that performs the actual concurrent requests. (For those familiar with Javascript, an errgroup is similar to Promise.All()). A semaphore is also defined which represents the maximum number of concurrent requests that can be made to our server.
(2) Trigger Requests in Goroutines
The whole request lifecycle is encapsulated within a Goroutine, and this Goroutine is only triggered once a lock can be claimed from the semaphore. For this load testing, the endpoint for Magic Link generation will be used.
An important note when performing a high number of HTTP requests is that most libraries will pool the HTTP connections, such that the program does not overload the number of network sockets on the system. In order for a HTTP connection to be considered "completed", the body of the response received after performing a request needs to be read fully. Otherwise, the HTTP connection will not be returned to the connection pool, and as a result, the client will experience a socket exhaustion error while performing the load test.
Docker
In order for our experiment to produce consistent results, we leverage on Containers to encapsulate our program.
# Stage 1: Build the Go application
FROM golang:1.25-alpine AS builder
WORKDIR /app
# Copy go mod files
COPY go.mod go.sum ./
RUN go mod download
# Copy source code
COPY . .
# Build the application with optimizations
# -ldflags="-s -w" strips debug symbols, reducing binary size
# CGO_ENABLED=0 creates static binary, no C dependencies
RUN CGO_ENABLED=0 GOOS=linux go build -ldflags="-s -w" -a -o main .
# Stage 2: Create minimal runtime image
FROM scratch
# Copy only the built binary, and public assets from the builder stage
COPY /app/main /main
COPY /app/static /static
COPY /app/templates /templates
# Copy CA certificates for HTTPS if needed
# COPY --from=builder /etc/ssl/certs/ca-certificates.crt /etc/ssl/certs/
# Expose ports
EXPOSE 8080 6060
# Run as non-root user for security
USER 1000:1000
# Set minimal environment
ENV GOMAXPROCS=1
# Health check
HEALTHCHECK \
CMD ["/main", "health"] || exit 1
ENTRYPOINT ["/main"]
The above script shows a Dockerfile, for packaging our application into a production ready container.
docker run -d \  --name myapp \
  --memory=64m \
  --memory-swap=64m \
  --memory-swappiness=0 \
  --cpus="0.5" \
  -p 8080:8080 \
  -p 6060:6060 \
  -e GIN_MODE=release \
  myapp:latest
When invoking the container, a strict constrained environment can be defined to test specific areas of our application. An example is shown above.
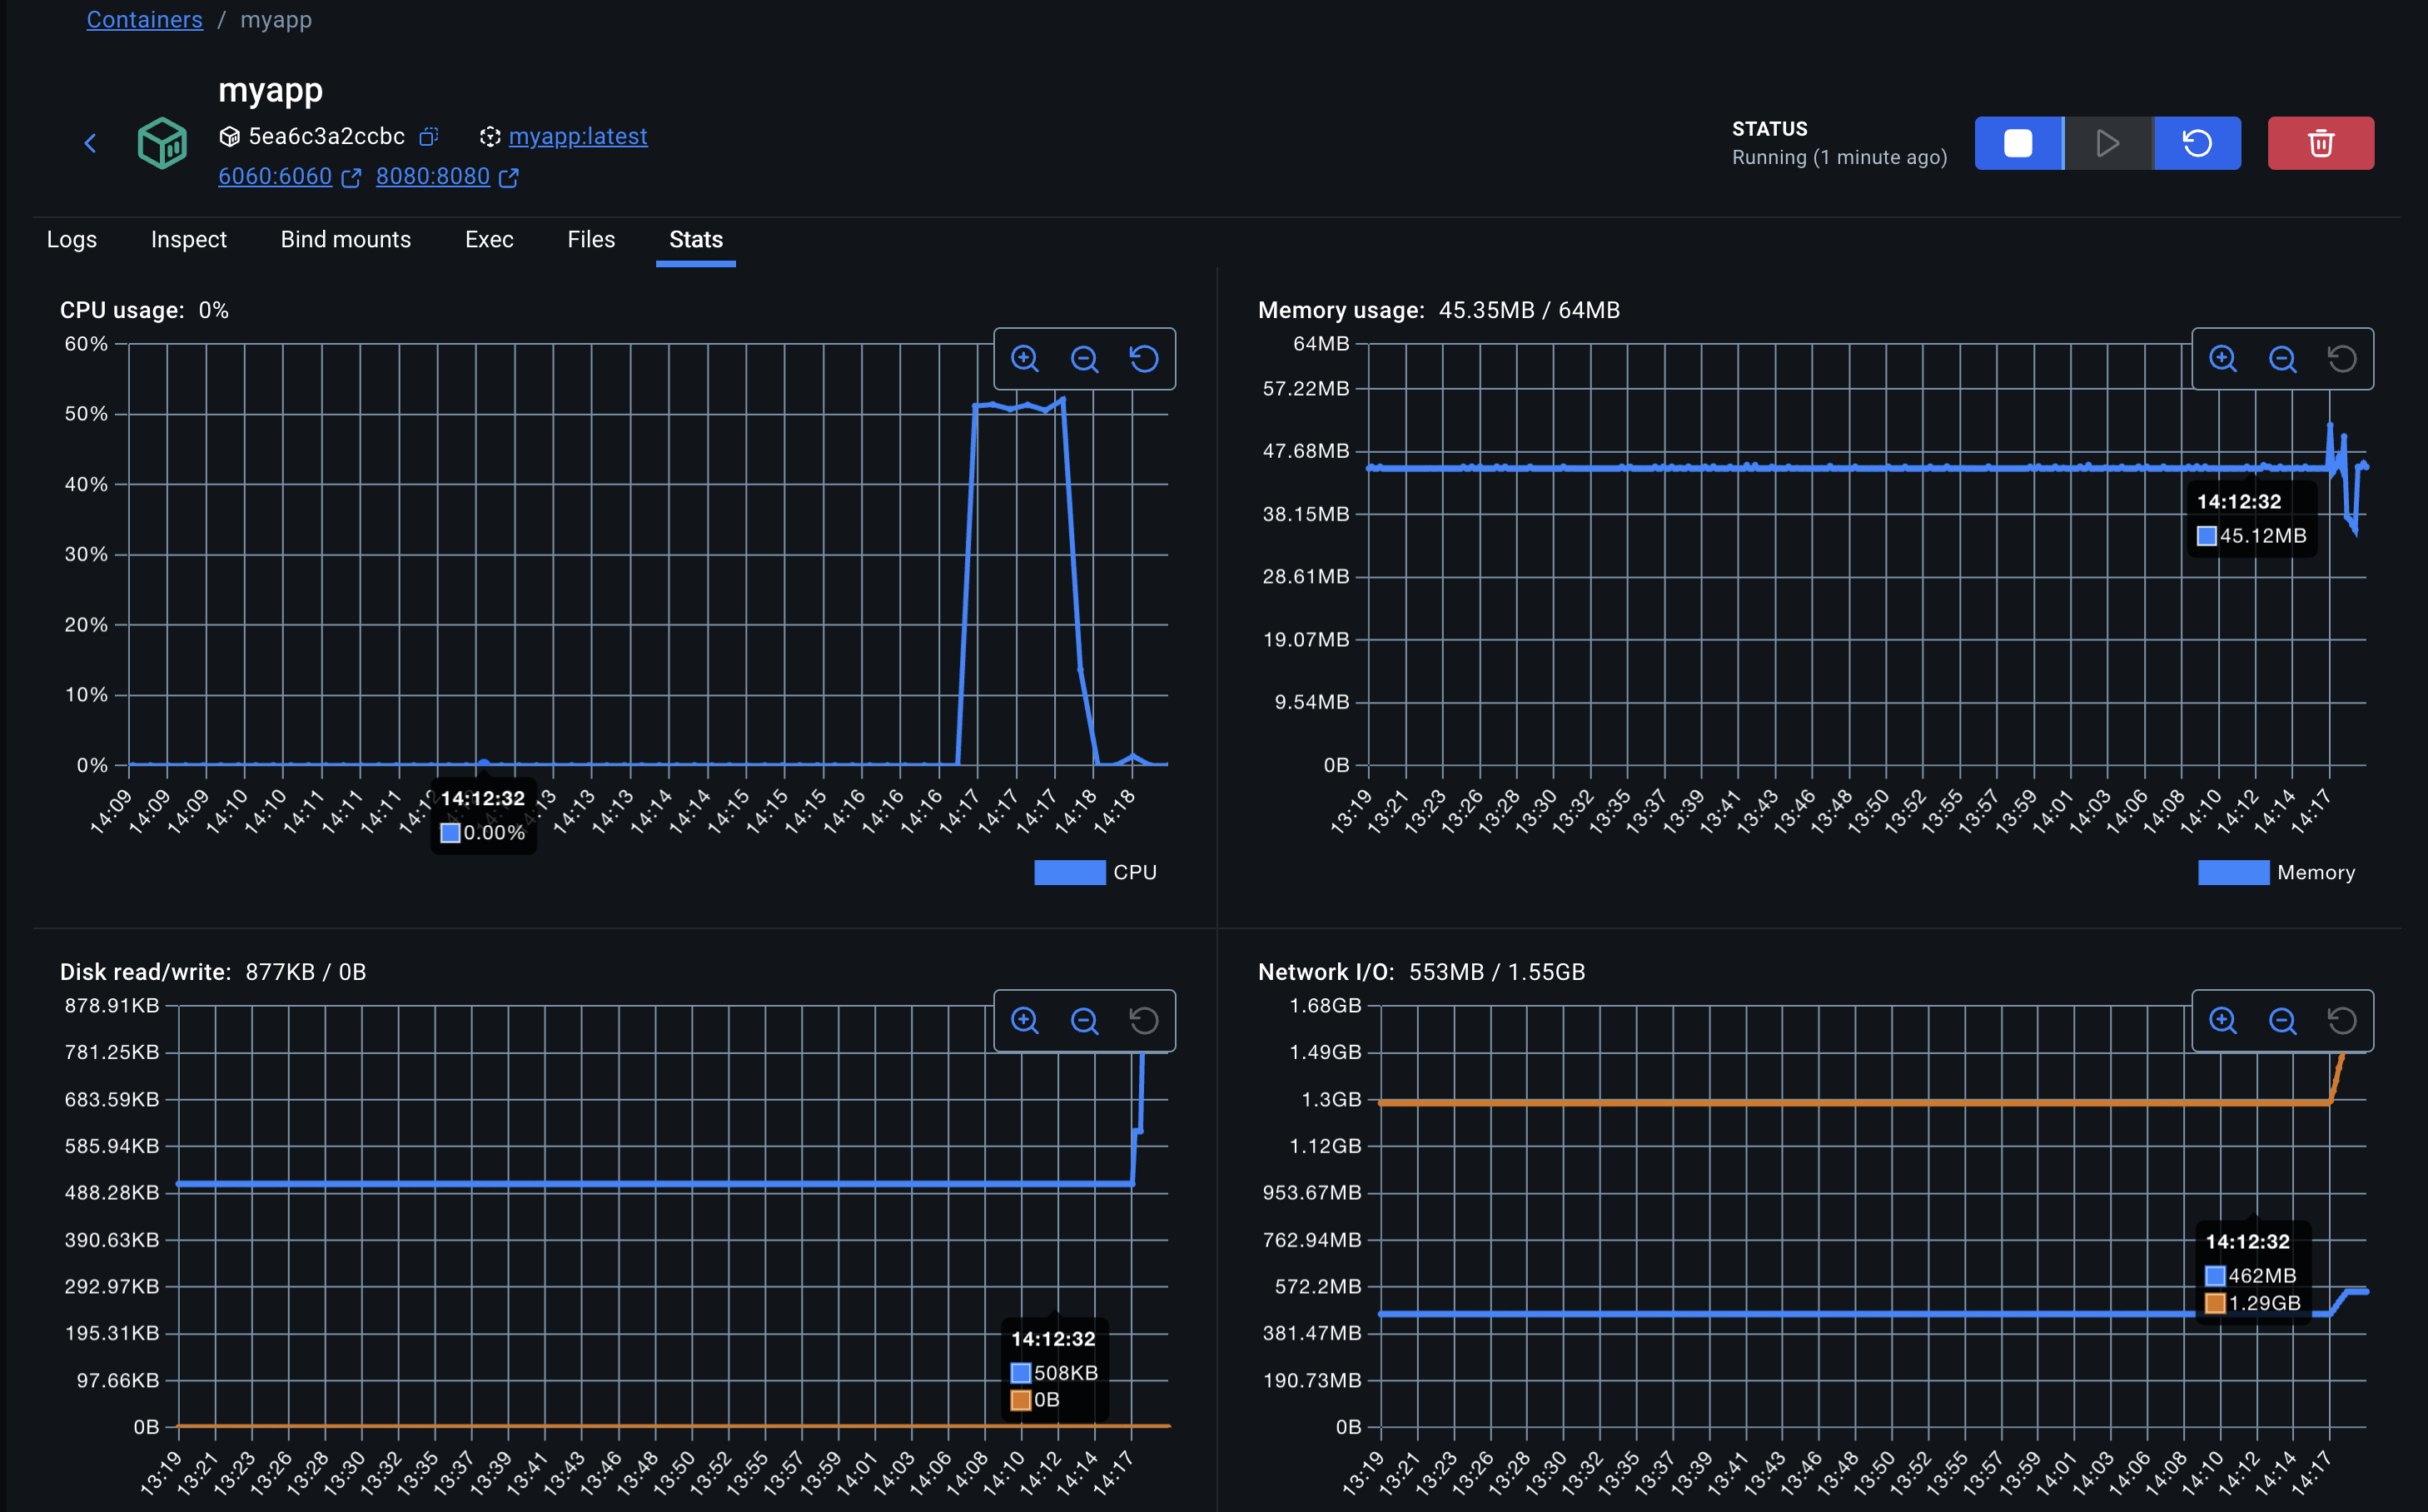
The parameters of our Load Testing script can be defined by experimenting with the values, and observing the stability of the container metrics in the Docker Desktop UI. In our scenario, 500 concurrent requests is a good number to start with for a 64MB container.
More details into pprof analysis will be in the next post. Stay tuned!
- ← Previous
CSRF with Magic Links - Next →
pprof Analysis