pprof Analysis
Now that we have generated the pprof profiles for our Magic Link app, let's start analyzing them.
There are a lot of information provided by the profiles, and in order to not get overwhelmed, we need to adopt a strategy to analyze them.
Strategy
We will be mostly using flamegraphs to analyze the profile data. Flamegraphs provide a high level overview of the time or resource spent in certain areas of your app, and because it uses a collection of bar graphs, we can easily identify bottlenecks by looking at the width of a bar relative to the overall app.
Below are the various sections of profile analysis, and I recommend going through them sequentially in order to not get overwhelmed.
Table of Contents
Resource Utilization
Latency Reduction
Resource Utilization
Blocking Operation
go tool pprof -http=:8082 ./block.pprofMost likely due to the fact that we are running everything on localhost, hence, there is no information here. Will elaborate more on this in future posts!
Mutex
go tool pprof -http=:8082 ./mutex.pprofThe Magic Link Generation handler is currently not dealing with mutexes for resource sharing, hence, there is no information here.
Goroutine
go tool pprof -http=:8082 ./goroutine.pprof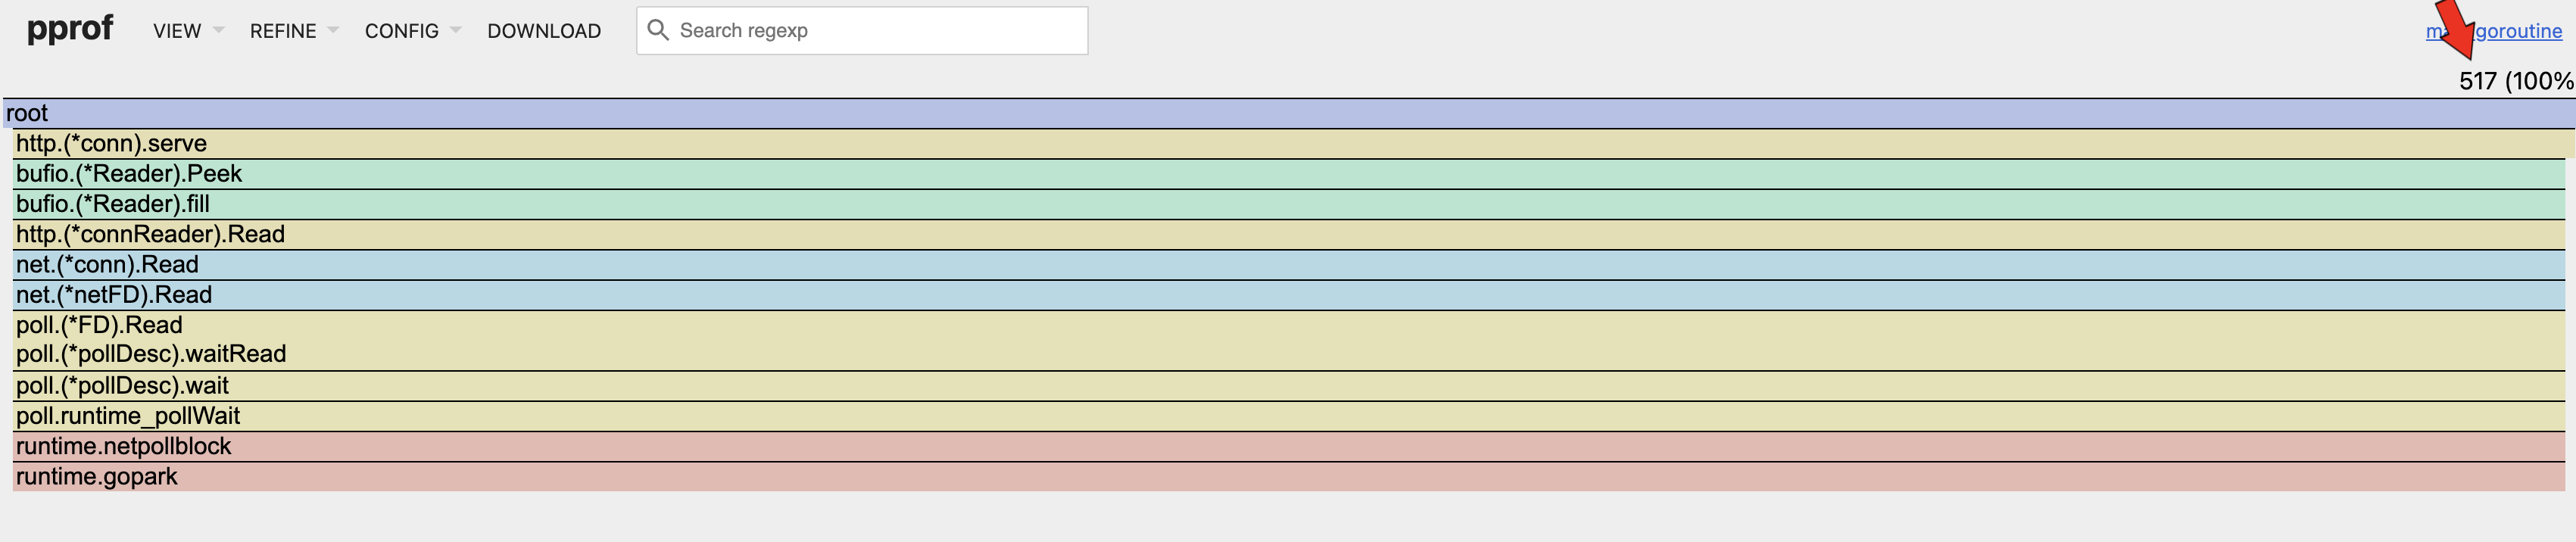
Number of Goroutines
By referencing the flamegraph, it can be seen that the number of goroutines spawned (517) is approximately equal to the concurrent requests (500) made during the load test. It can also be seen that there is only one branch of goroutines which is inline with our implementation. In conclusion, there is no issue here.
Heap
go tool pprof -http=:8082 ./heap_rate.pprof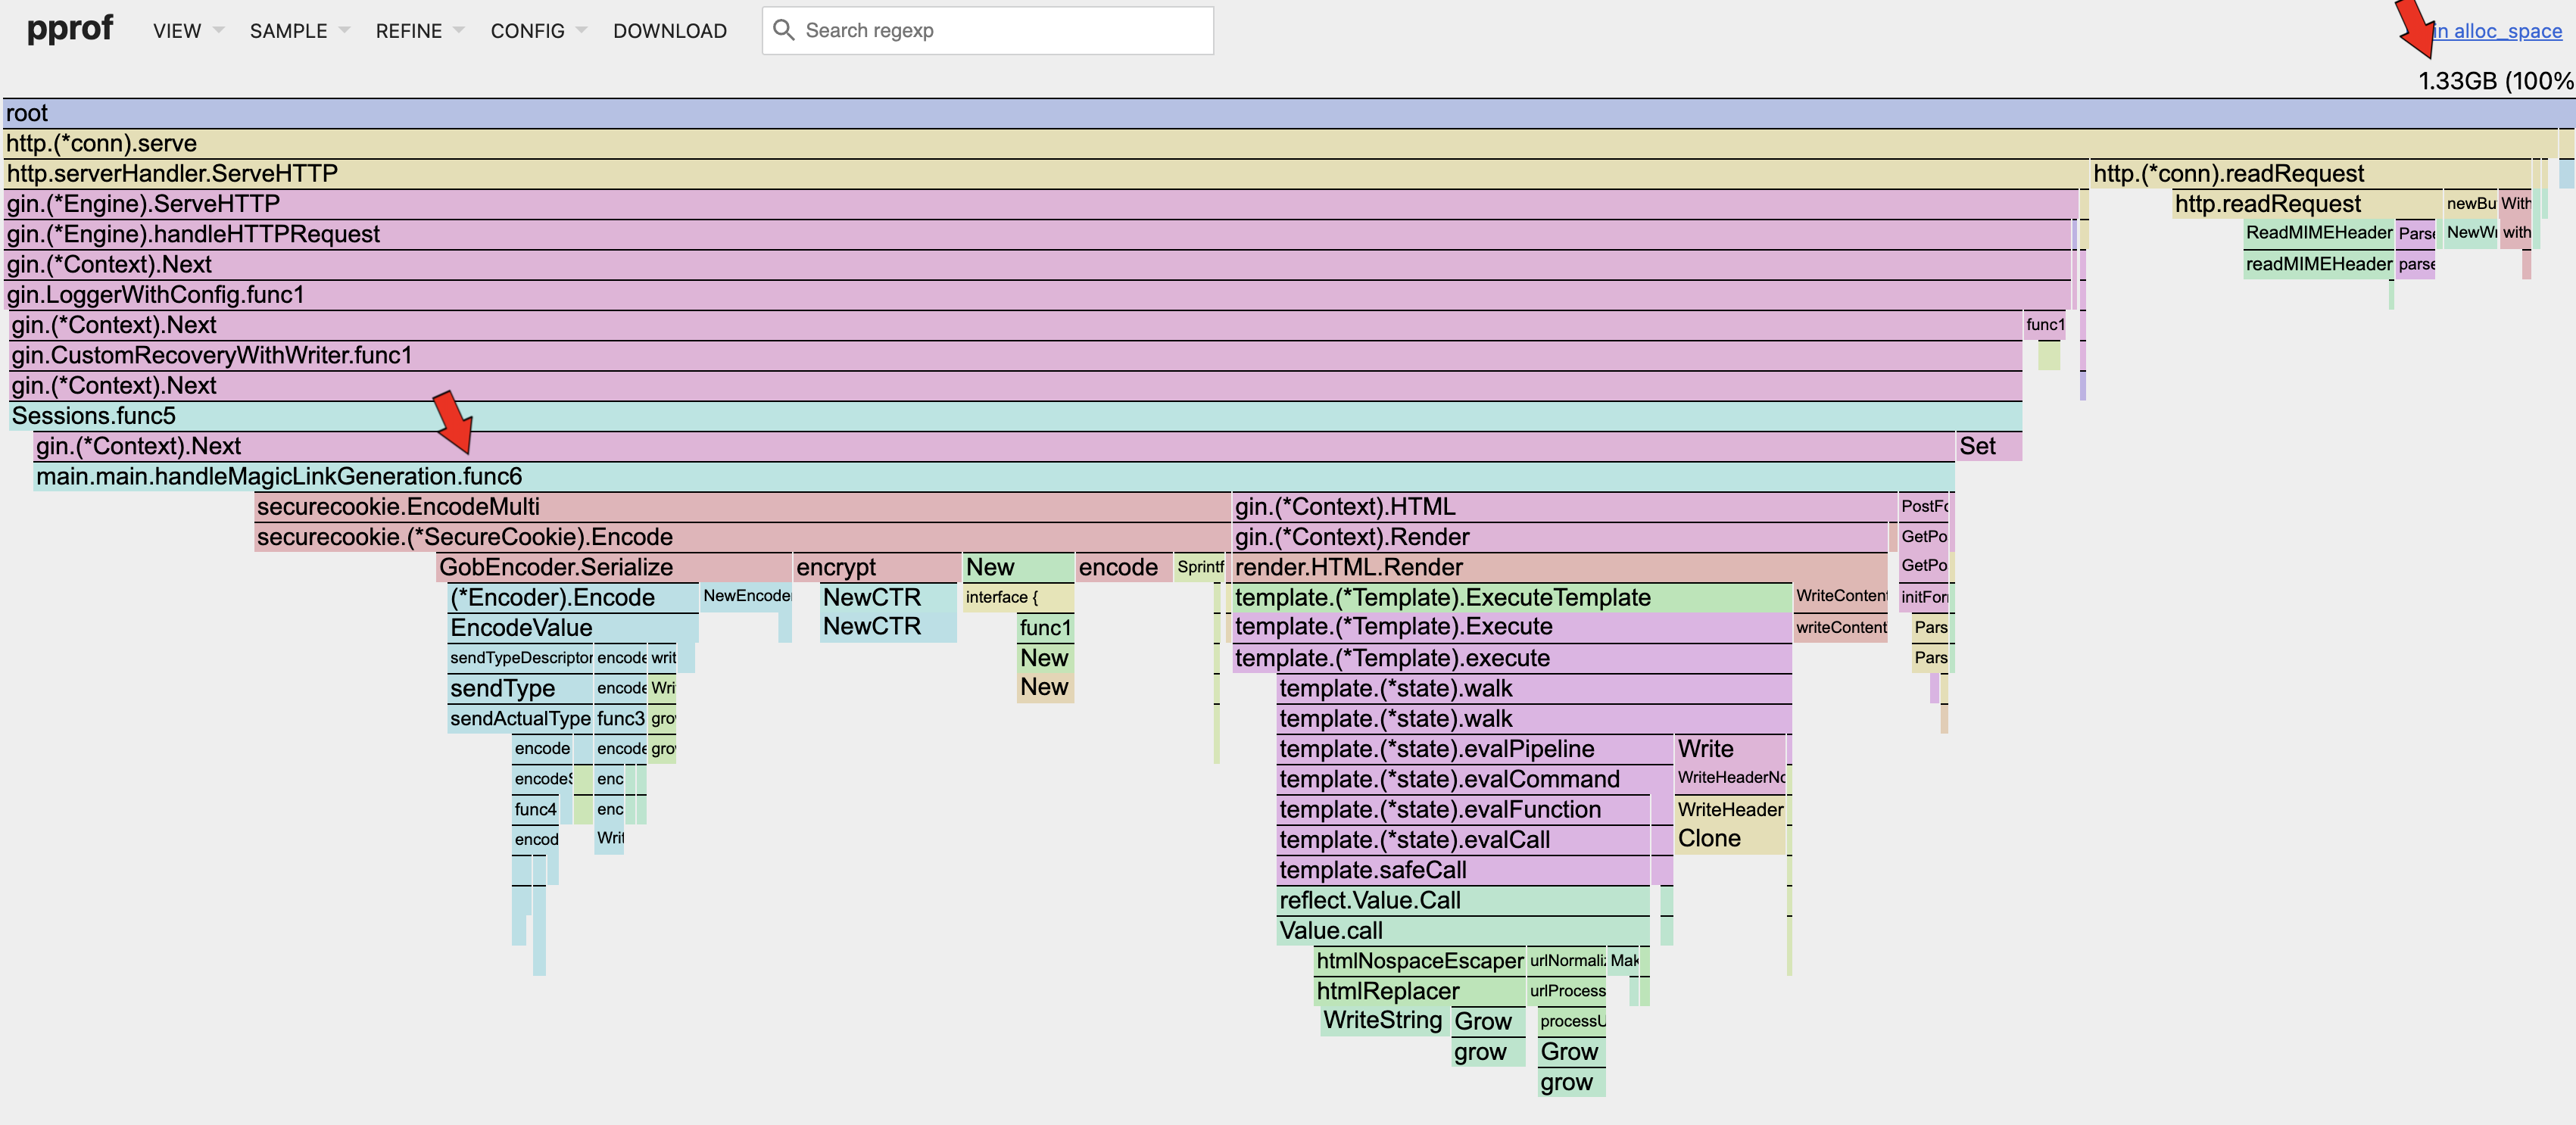
Heap Allocated Space
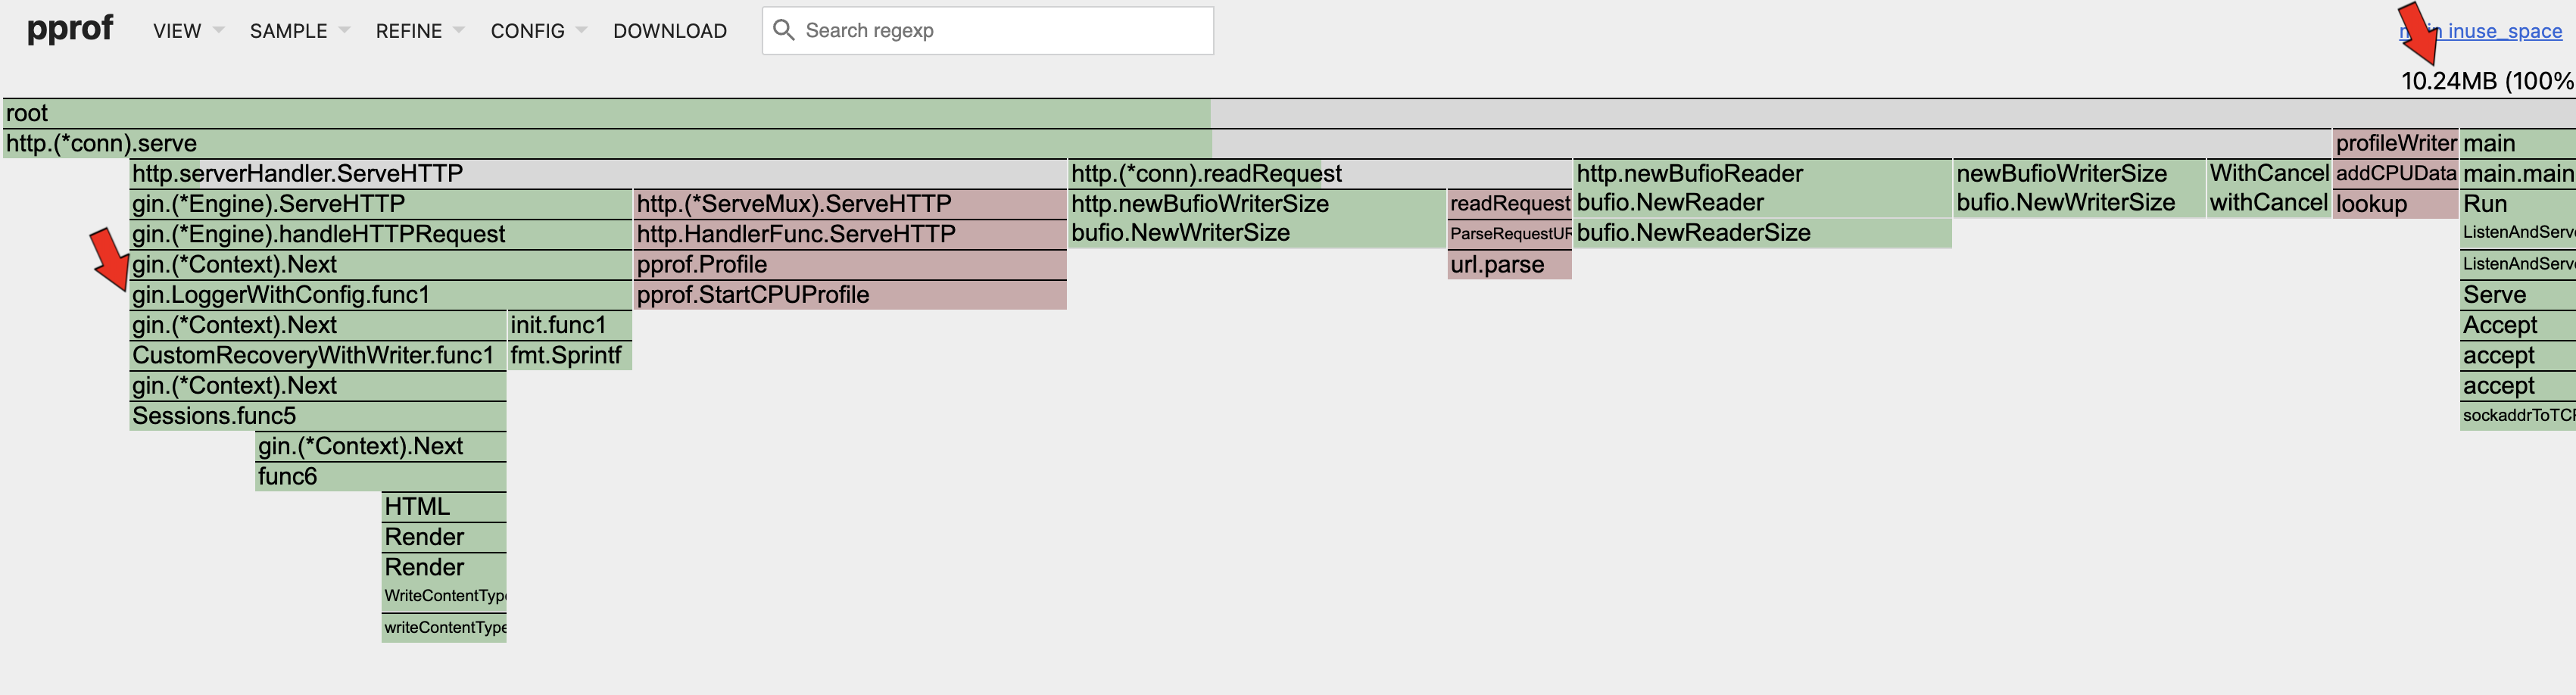
Heap In-Use Space
Click to show/hide invalid old content
I had a wrong understanding on the matter, detailed below.
Looking at the 2 flamegraphs above, it can be seen that the in-use space (10.24MB) is much smaller than the allocated space (1.33GB). That means that the current allocated memory utilization is only ~0.7%! That is extremely low! The in-use memory utilization is very low as well (10.24MB / 64MB ~= 16%).
There are opportunities for improvements here.
Remember that our Docker container is only allocated 64MB of memory? Have you wondered how is it possible for the memory allocation during load test to reach 1.8GB? This is because of the wonderful Garbage Collector present in Go programs. It is so efficient that it can handle our badly written code effectively at scale; i.e. 500 concurrent requests. Memory is constantly allocated per request and discarded at the end. Although the GC is efficient, it still provides an opportunity to make improvements to our app.
Basically, we do not want the allocated memory to grow exponentially over time, such that we rely too much on the GC. Each time the GC runs, the app basically pauses and that introduces latency. Once the allocated memory utilization is stable, we mostly likely can increase the number of concurrent requests to increase the in-use memory utilization, making full use of our resources while increasing throughput.
Looking at the top right corner of each memory profile, we can see the memory allocated or in-use by the app during the load test. I once thought that the high allocated memory was an issue but in fact, that number alone does not mean anything. Instead, we need to take the rate of change of how the allocated memory grows with the increase in concurrent requests. For this app, the allocated memory and in-use memory remains relatively constant as the concurrent requests increases. The in-use memory should also be much lower than the allocated memory to ensure that there are no memory leaks in the app such that the GC is unable to reclaim them; in this case the in-use memory is fine as well.
Another reason to optimize the allocated memory is when the CPU utilization on GC is high (>10%); more on that in the next section.
Areas of optimization can be seen in the flamegraph: the Serializer and the HTML templating engine.
CPU
go tool pprof -http=:8082 ./cpu.pprof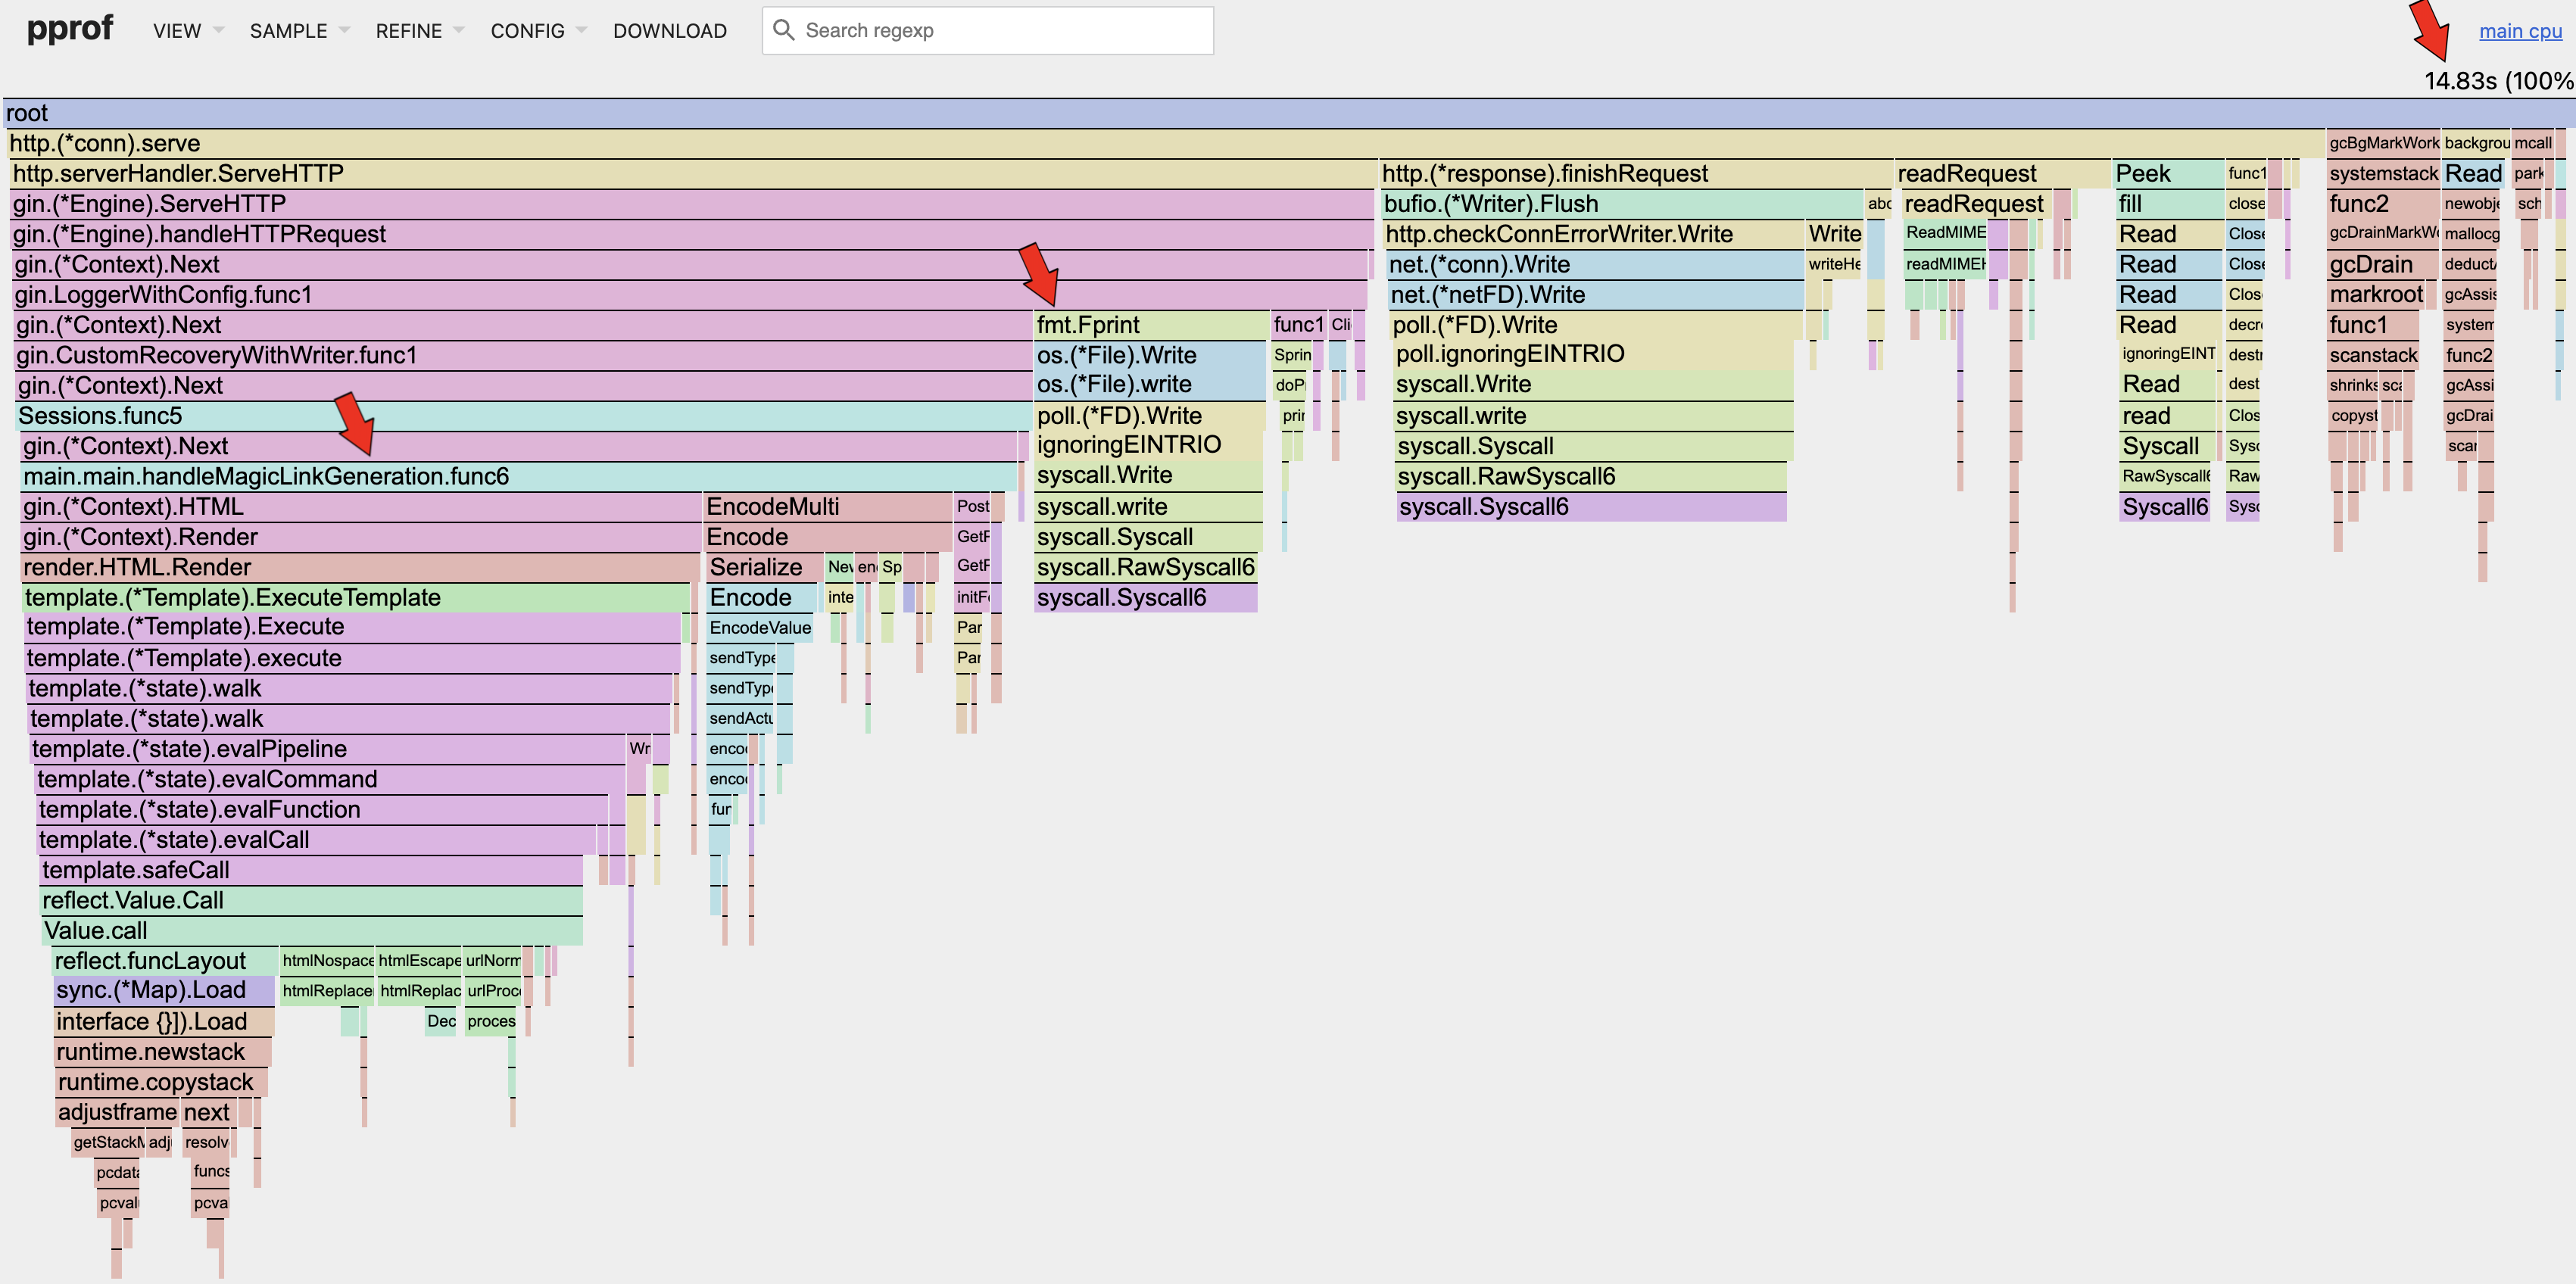
CPU
The current CPU utilization is (14.83s / 30s ~= 49%). This means that the CPU still has room to process more concurrent requests, but due to the app reaching the RSS limits as seen in the Docker metrics, the app can't handle more concurrent requests.
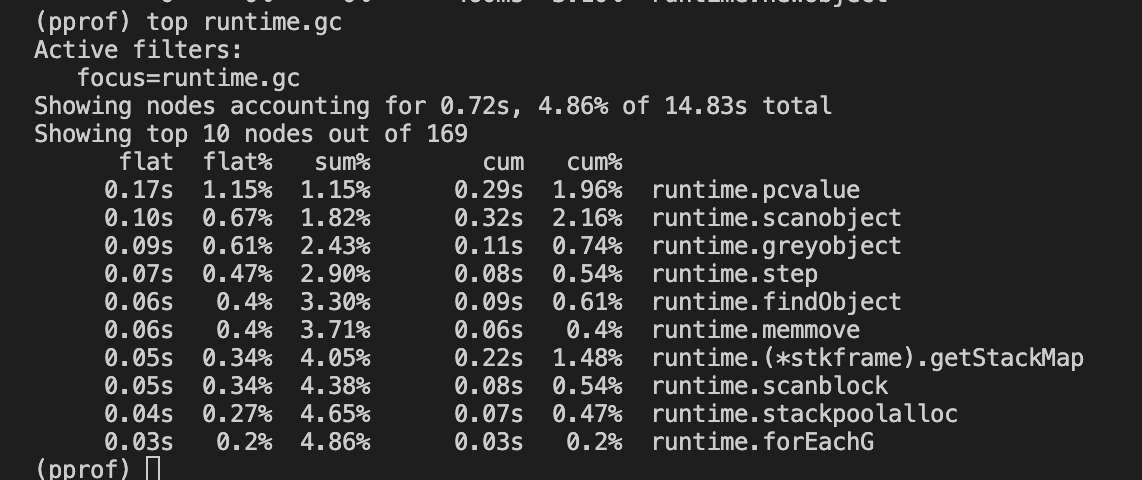
CPU GC (TOP 10)
The Top 10 GC related functions utilize only about ~5% of the CPU utilization. Hence, there is no issue with the memory allocation mentioned in the previous section.
Latency Reduction
CPU
Referencing the CPU flamegraph in the previous section, we can see that our Magic Link Generation handler consumed 38.6% of the overall CPU, and (38.6% / 89.8% ~= 43%) of the http request & response lifecycle.
Before optimizing the actual application code written by the developer, we should try to remove or reduce other sections of code that consumes the CPU.
Looking at the fmt.Fprint under the gin.LoggerWithConfig.func1 section, we can see that it takes up 9.2% of the overall CPU. We can look at optimizing the default logger for gin, before optimizing else where.
When dealing with latency, we will need to do proper benchmarking in-order to quantify the potential gains achieved. Betterstack has a good article describing this process.
Conclusion
The app is currently fine and there is no need for optimizations as there will be diminishing returns with respect to the effort needed.
However for practice, the priority of optimization tasks is as follows:
- To increase the allocated memory utilization of the app.
- To increase the in-use memory utilization of the app.
- To reduce the latency of our app.
Stay tuned to future blog posts where we will dive deep into each area!
- ← Previous
pprof & Load Testing - Next →
pprof Memory Optimization