pprof CPU
CPU
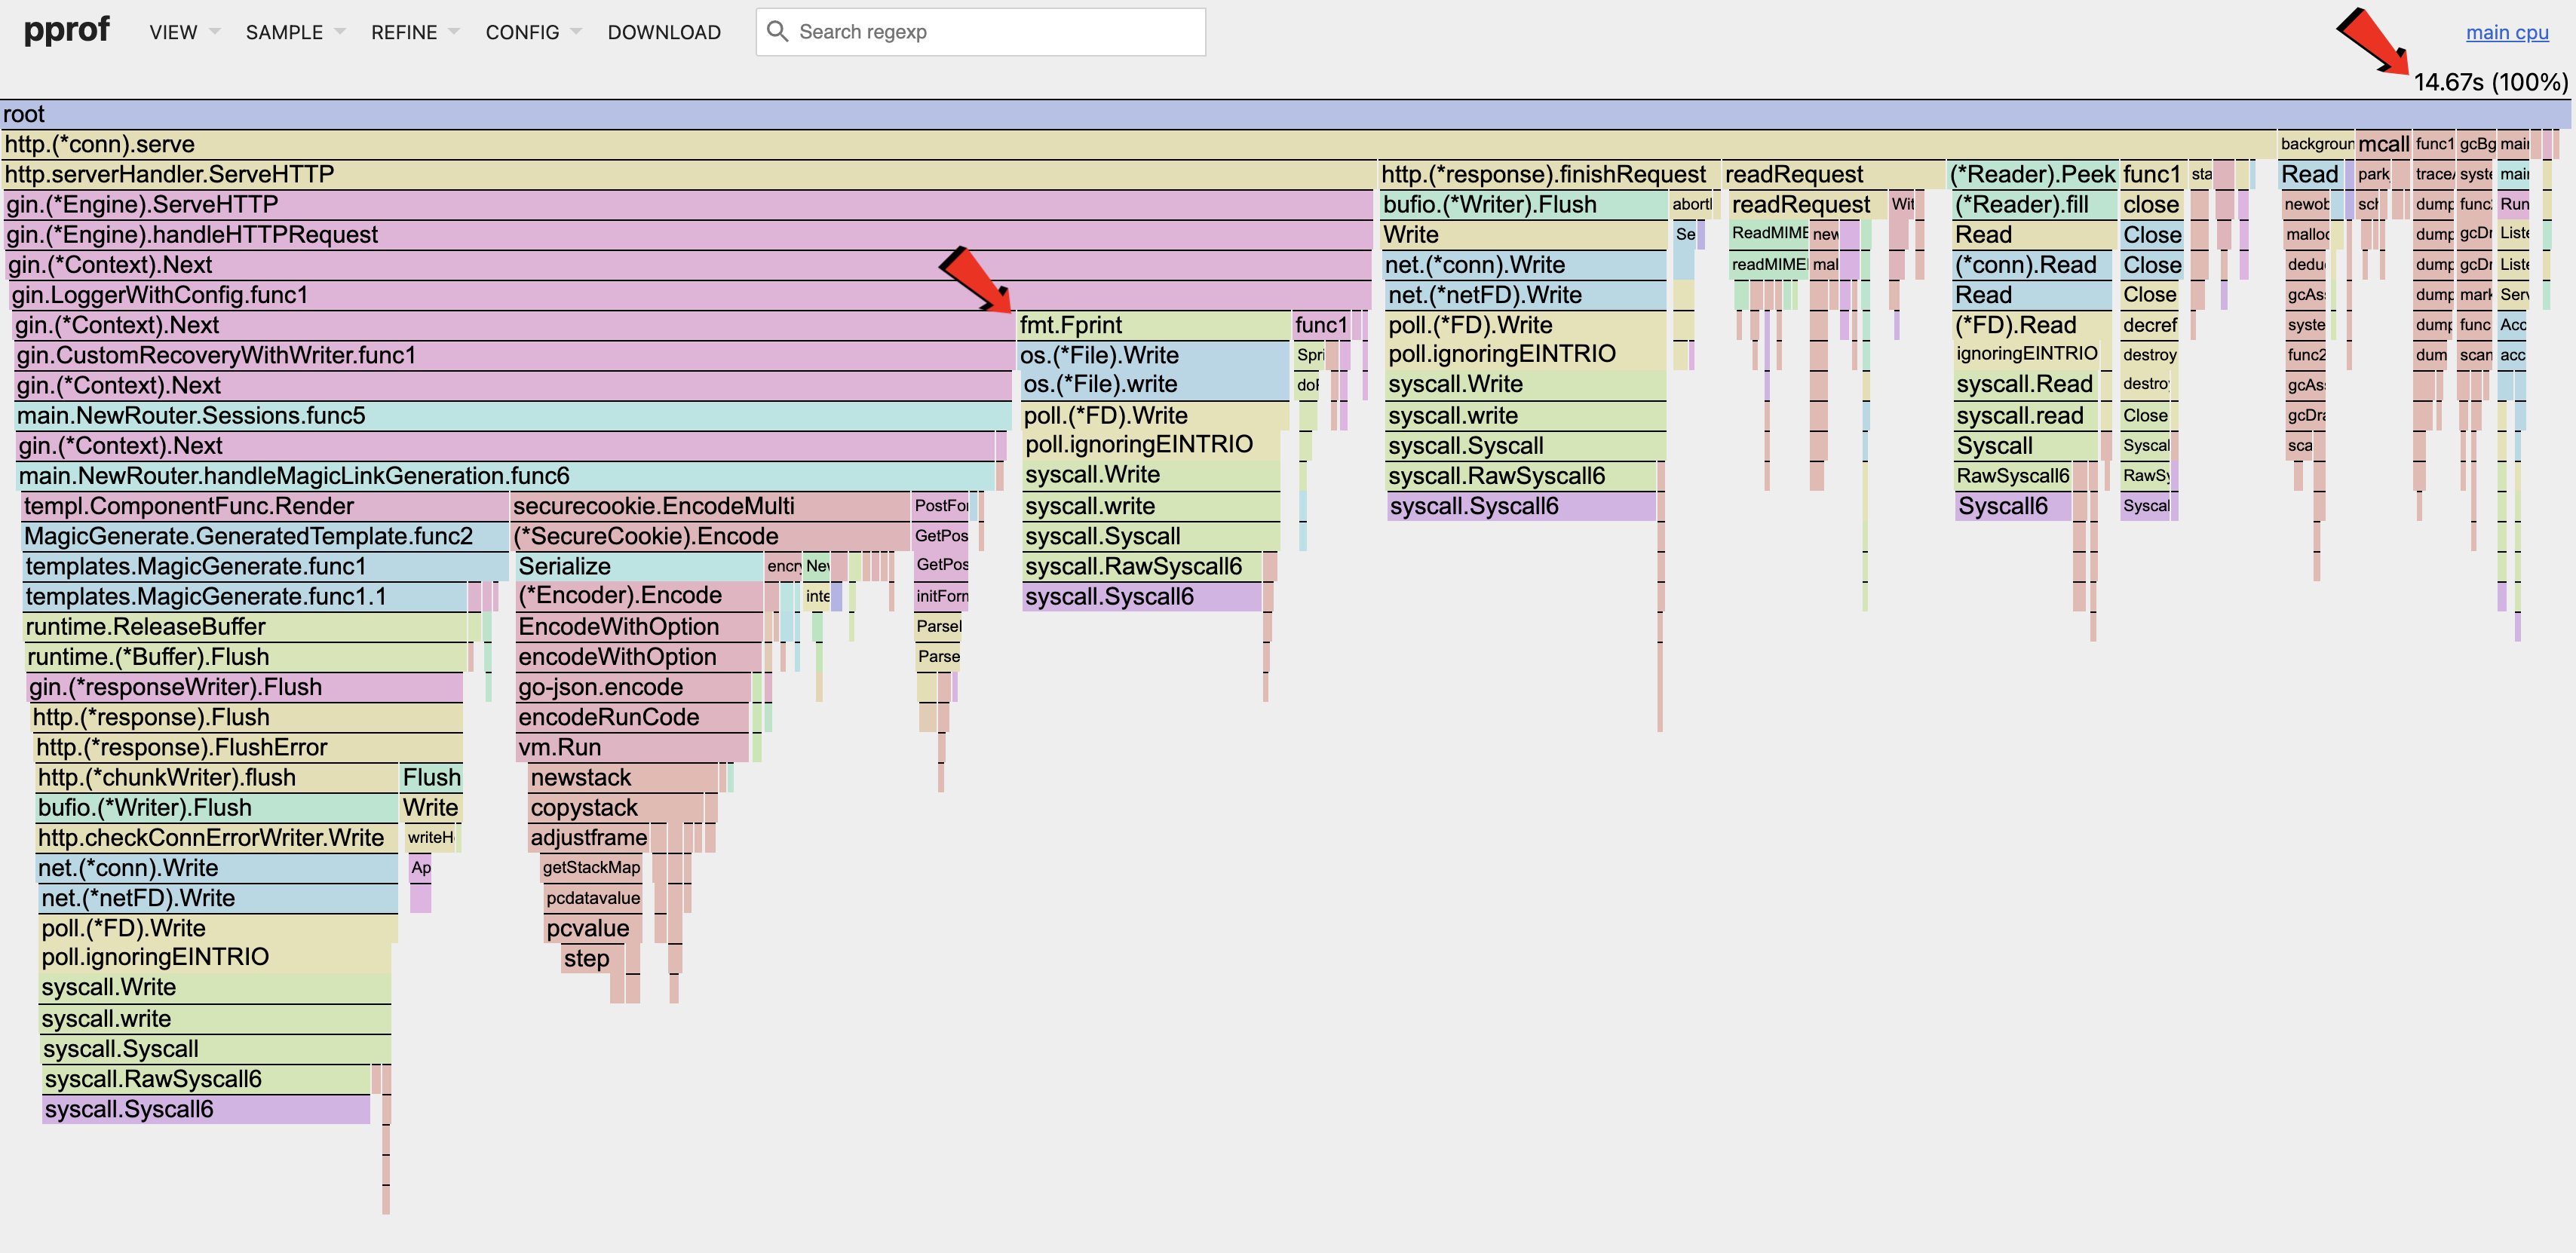
The above CPU flamegraph shows the CPU utilization after the memory optimizations made in the previous post.
As seen in the flamegraph, the Magic Link handler takes up less than half of the CPU utilization during the sample period. This is expected as it is a very simple handler. Majority of the compute in the handler is used for encryption, while the rest is part of the HTTP lifecycle.
One area of optimization would be the fmt.Fprint section that is part of the Gin logger. Every request coming in will be logged synchronously, triggering syscalls which consumes CPU utilization.
Benchmarks
When dealing with CPU utilization or latency, we need to gather baseline metrics of our system before making improvements, such that we can compare the results.
// benchmark_test.go
package main

import (
	"net/http"
	"net/http/httptest"
	"testing"
)

const (
	Host               = "http://127.0.0.1:8080"
	GenerateMagicRoute = "/magic/generate"
)

func BenchmarkGin(b *testing.B) {
	router := NewRouter(true)
	req, err := http.NewRequest(http.MethodPost, Host+GenerateMagicRoute, nil)
	req.Header.Set("X-CSRF-Token", generateCsrf())
	if err != nil {
		b.Error(err)
		return
	}
	b.ResetTimer()
	for b.Loop() {
		w := httptest.NewRecorder()
		router.ServeHTTP(w, req)
	}
}
The above code shows a simple benchmark test that is focus on the Magic Link handler, with the results shown below.
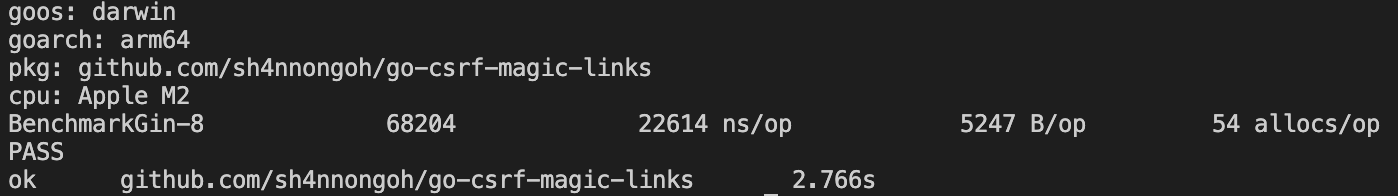
Benchmark Results (baseline)
Metrics Legend
| Symbol | Description |
|---|---|
| op | Operation |
| ns | Nano-seconds |
| allocs | Number of Memory Allocations |
| B | Bytes Allocated |
Buffered Logging
Writing logs to disk synchronously per request is slow. Unless your system is fragile, and you fear that logs go missing on your critical path, it makes sense to buffer the incoming logs before writing them to disk; grouping such calls reduce syscalls.
The logging library Zap, supports this and is the fastest so far among other libraries.
When replacing the default Gin logger, we need to add 2 middlewares: (1) Logging; (2) Recovery.
func MiddlewareZapLogger(logger *zap.Logger) gin.HandlerFunc {
	return func(c *gin.Context) {
		start := time.Now()
		path := c.Request.URL.Path
		raw := c.Request.URL.RawQuery
		if raw != "" {
			path = path + "?" + raw
		}

		c.Next()

		latency := time.Since(start)

		logger.Info("http request",
			zap.Int("status", c.Writer.Status()),
			zap.String("method", c.Request.Method),
			zap.String("path", path),
			zap.String("ip", c.ClientIP()),
			zap.Duration("latency", latency),
			zap.String("user_agent", c.Request.UserAgent()),
			zap.Int("bytes_out", c.Writer.Size()),
			zap.String("errors", c.Errors.ByType(gin.ErrorTypePrivate).String()),
		)
	}
}

func MiddlewareZapRecovery(logger *zap.Logger) gin.HandlerFunc {
	return gin.CustomRecovery(func(c *gin.Context, recovered any) {
		logger.Error("panic recovered",
			zap.Any("error", recovered),
			zap.String("method", c.Request.Method),
			zap.String("path", c.Request.URL.Path),
		)
		c.AbortWithStatus(http.StatusInternalServerError)
	})
}

func main() {
  // ...

  logger, err := zap.NewProduction()
	if err != nil {
		_ = fmt.Errorf("failed to run router: %w", err)
		return
	}
	defer logger.Sync()
  router := gin.New()
	router.Use(MiddlewareZapLogger(logger))
	router.Use(MiddlewareZapRecovery(logger))

  // ...
}
Running the benchmarks again, we can see the optimized results below.

Benchmark Results (Optimized)
Using the Zap logger, latency was improved by (22614-5430) / 22614 = ~76%. This is a huge speed improvement!
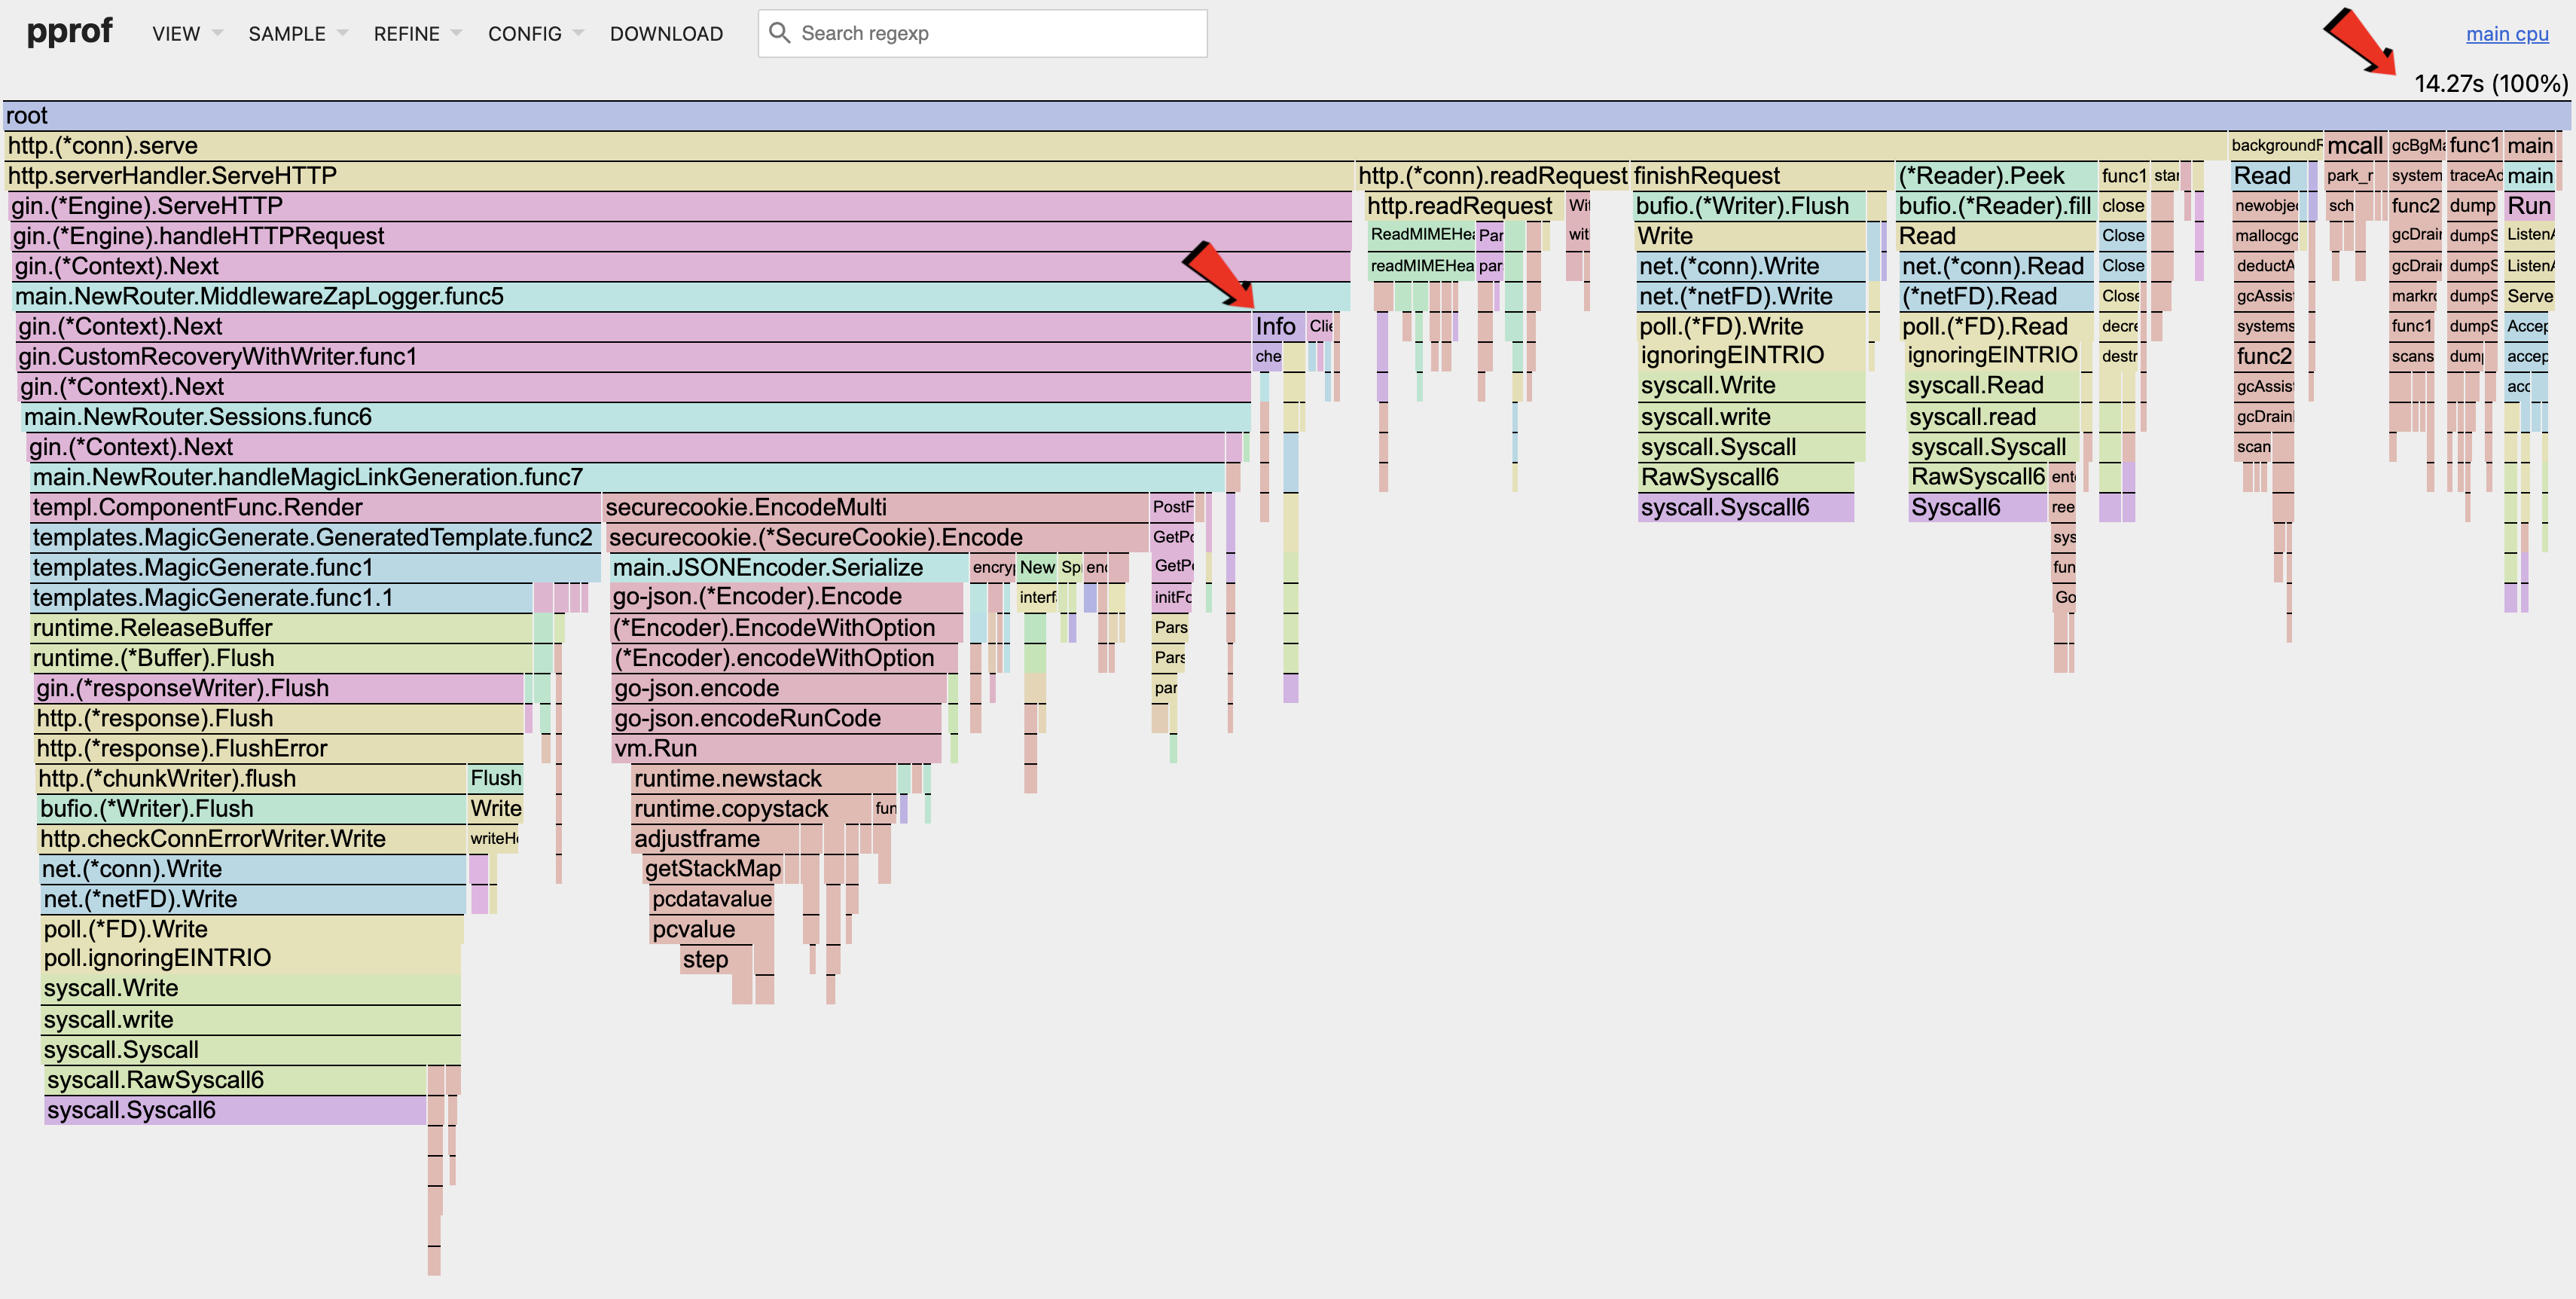
CPU (Optimized)
Looking at the flamegraph, we can see that the fmt.Fprint section is gone, and that the syscalls are greatly reduced.
The CPU utilization is still low as we can't increase the number of concurrent requests due to the RSS limit mentioned here.
- ← Previous
pprof Memory Optimization - Next →
AI Agents